
What Your Bone Density Scan Results Really Measure
Bone density scan results explained clearly start with one basic fact: this scan measures how much mineral is packed into your bones right now. That mineral content shapes how dense your bones are and how well they hold up under everyday stress.
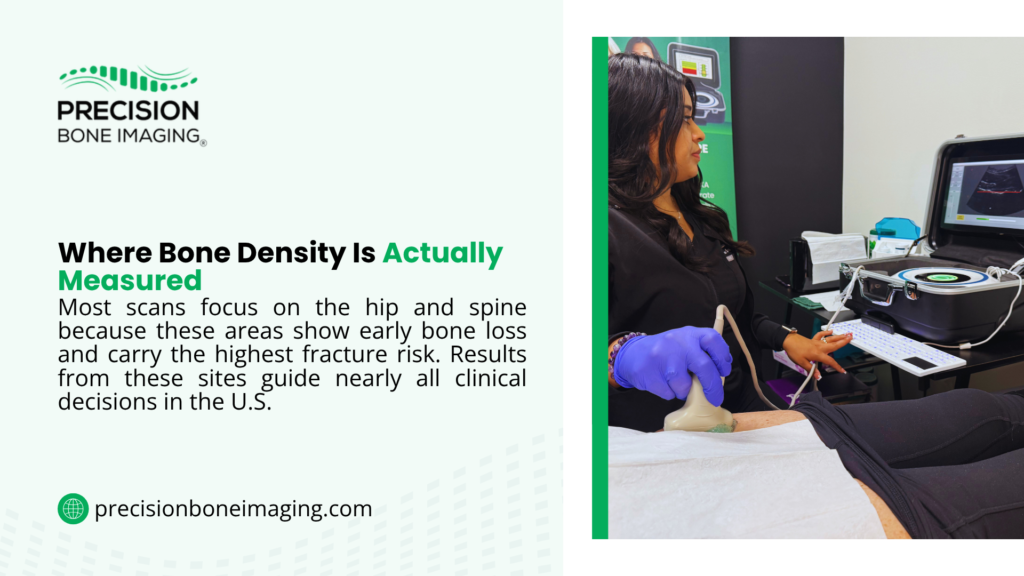
The scan assesses calcium and other minerals at the hip and spine, the two sites most prone to fracture as bone mass naturally shifts with age. Most standard scans return a T-score and a Z-score, which tell you where your density sits relative to two different comparison groups.
For a full look at how scan types differ on radiation and what each measures, a side-by-side review of DXA vs rems radiation covers the key distinctions between standard DXA and the newer REMS approach.
| What the Scan Measures | What It Tells You |
| Bone mineral density (BMD) | How much mineral is in your bone tissue |
| T-score | Your density compared to a healthy young adult |
| Z-score | Your density compared to others your age and sex |
| Fragility Score (REMS only) | The structural quality of your bone tissue |
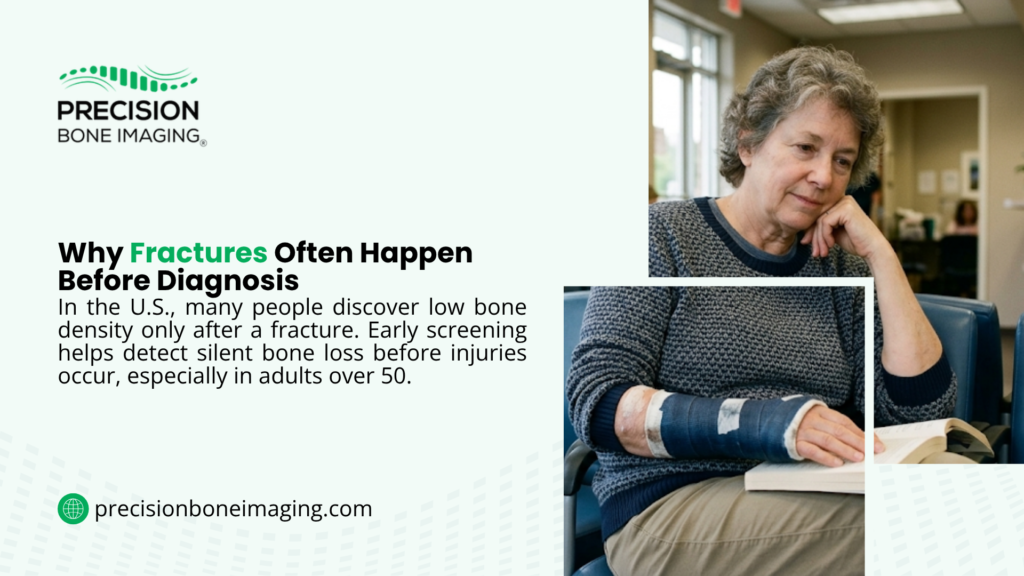
According to Healthy People 2030, an estimated 10 million Americans over 50 have osteoporosis, and more than 43 million have low bone mass. Most do not learn their status until after a fracture has already occurred.
Bone density scan results give you an early window to act, long before symptoms appear.
Standard scans measure density only. They do not automatically capture bone quality, which is an equally important factor for real-world fracture risk. That distinction is covered in detail later in this guide.
Understanding T-Scores and Z-Scores
Your bone density scan results will almost always include two numbers: a T-score and a Z-score. These are not diagnoses, but are reference points that show where your bone density falls compared to two different groups.
A T-score compares your bone density to that of a healthy 30-year-old adult of the same sex. A Z-score compares your density to others of the same age, sex, and body size. For adults over 50, the T-score is the number most used for fracture risk assessment.
| Score Type | What It Compares | Who It Helps Most |
| T-score | Your BMD vs a healthy young adult | Adults over 50 |
| Z-score | Your BMD vs peers your age and sex | Adults under 50 |
| Z-score below -2.0 | May signal an underlying condition | Warrants further clinical evaluation |
Per World Health Organization classification, confirmed across multiple clinical sources, T-scores fall into three standard categories:
- -1.0 or above: Normal bone density
- -1.0 to -2.49: Osteopenia (lower than average bone density)
- -2.5 or lower: Osteoporosis range
These ranges apply to postmenopausal women and men over 50. For younger adults, the Z-score gives more useful context.
What a Healthy Bone Density Range Looks Like
A T-score of -1.0 or above places you in the normal range. This means your bone density is at or above the average for a healthy young adult. It is a solid foundation that responds well to consistent weight-bearing activity, good nutrition, and regular follow-up over time.
What Osteopenia Means for Your Bone Health Journey
A T-score between -1.0 and -2.49 falls in the osteopenia range. This is not a disease. It is an early signal that bone strength deserves more attention.
What Osteoporosis Means in Simple Terms
A T-score of -2.5 or lower places results in the osteoporosis range. Bone mineral density is significantly lower than the young adult reference average at this level, and the risk of fracture from low-impact events is higher.
From a clinical standpoint, this range calls for closer professional follow-up, consistent lifestyle effort, and a clearer look at bone quality alongside density.
How to Read Your Bone Density Scan Results in Real-Life Terms
Bone density scan results explained in plain terms come down to this: your score is a snapshot of where your bone health stands today. It does not tell you where it has to stay.
| T-Score Range | Classification | What It Means Day to Day |
| -1.0 or above | Normal | Bone density is strong; continue current habits |
| -1.0 to -2.49 | Osteopenia | Lower density; prevention becomes a clear priority |
| -2.5 or lower | Osteoporosis range | Closer follow-up and professional support become important |
Two people with the exact same T-score can carry different levels of fracture risk in practice. Age, muscle strength, bone quality, and fall history all shape the real-world picture in ways a single number cannot.
Results make the most sense when read alongside your full personal health context, not as a standalone figure.
What Happens After You Receive Your Bone Density Scan Results
Bone density scan results are the starting point, not the conclusion. What comes next depends on where your results land and what other factors apply to you personally.
| Result Category | Typical Next Step | Core Focus |
| Normal (T-score -1.0 or above) | Maintain habits; rescan on schedule | Weight-bearing movement, protein |
| Osteopenia (-1.0 to -2.49) | Prevention-focused lifestyle plan | Exercise, nutrition, rescan timeline |
| Osteoporosis range (-2.5 or lower) | Professional follow-up and closer tracking | Bone strength support, progress measurement |
When Your Results Indicate Stability
A normal result means your bone density is currently in a healthy range. This is good news, but it still calls for ongoing effort. Bone density shifts gradually with age, hormonal changes, and daily habits over the years.
Daily weight-bearing movement, adequate protein and vitamin D help with keeping your results stable between assessments.
When Your Results Indicate Early Bone Loss Awareness
An osteopenia result means lower bone density has been detected at an early stage. This stage responds well to consistent action. Resistance exercise, good nutrition, and a clear rescan plan are the most direct tools available.
For practical, evidence-based steps at this stage, our guide on how to increase bone density covers the habits and nutritional inputs with the strongest research support.
When Results Require Closer Monitoring
Results in the osteoporosis range call for closer professional guidance and a shorter rescan interval. The priority at this stage is tracking whether bone strength holds or improves over time with consistent effort.
For adults already past 60 who want guidance built around this specific life stage, increasing bone density after 60 offers a focused, practical framework.
Common Misunderstandings About Bone Density Scan Results
Many people receive their bone density scan results and assume the situation is far worse than it actually is. That reaction is understandable, but it often comes from misreading what the numbers actually mean.
| Common Misunderstanding | What the Evidence Actually Shows |
| “Osteopenia equals osteoporosis” | Two separate ranges; osteopenia does not mean the same condition |
| “A low score means a fracture is coming” | Risk depends on many factors well beyond density alone |
| “My result is permanent” | Bone health responds to lifestyle and is measurable over time |
| “Only women need to worry about bone health” | Men over 50 carry real and significant fracture risk too |
| “A normal T-score means zero fracture risk” | Most fractures occur in people with osteopenia per clinical data |
From our experience working with bone health content, the most common error is treating a T-score as a final verdict. It is a reference point. One number at one point in time.
Bone quality adds a layer the score alone does not reflect. Two people with identical T-scores can carry meaningfully different fracture risk based on the structural integrity of their bone tissue, something a standard density scan does not capture.
What Affects Your Bone Health Results Over Time
Bone density is not fixed. Several factors shift your results over months and years, and a number of them are within your direct control.
| Factor | Impact Level | Notes |
| Age and hormonal shifts | High | Estrogen decline post-menopause accelerates bone loss |
| Resistance and weight-bearing exercise | High | Most direct stimulus for bone preservation |
| Smoking | Medium to High | Raises osteoporosis risk by 2.46x (PMC study, 2024) |
| Diabetes | Medium to High | Raises osteoporosis risk by 3.78x per the same analysis |
| Prior fracture history | High | Associated with 6.23x higher osteoporosis risk |
| Family history | Medium | Raises personal baseline risk independent of lifestyle |
A 2024 clinical study published in PMC, involving postmenopausal women aged 50 to 60, found that osteoporosis risk was 2.46 times higher in those who smoked, 3.78 times higher in those with diabetes, and 6.23 times higher in those with a prior fracture history.
Several of these factors are modifiable. Changing relevant habits early gives your future bone density scan results the best chance of shifting in a positive direction.
A full framework covering bone strength, muscle health, and fall risk together can be found in reducing fracture risk as you age.
Can Bone Density Improve Over Time?
Yes, bone density can improve over time, but how much it improves depends on things like your age, your starting bone health, your daily habits, and any treatments or changes you make.
A 2026 study in the Journal of Cachexia, Sarcopenia and Muscle found that a 13-week combined nutritional and activity program increased lumbar spine BMD by 3.0% and total body BMD by 0.7% in male participants.
What supports improvement:
- Consistent resistance training, osteogenic loading and weight-bearing activity
- Protein at every meal, as it forms the structural matrix bone mineral attaches to
- Appropriate micronutrients in diet, including minerals and vitamins such as D3 and K2.
- Avoiding alcohol intake and smoking cessation
- A rescan every 6 to 12 months to track whether the effort produces results
The logic here is direct: what you measure gets managed. Bone density scan results give you a starting point. A consistent plan gives you direction. A follow-up assessment tells you whether it is working.
Bone Density vs Bone Quality
Two people with the same T-score can carry very different real-world fracture risk. The reason is bone quality.
Bone density measures how much mineral is in your bone.
Bone quality measures the structural integrity of the bone tissue itself.
A standard scan captures density only.
| Measurement | What It Captures | What It Leaves Out |
| Bone density (standard scan) | Mineral content at the hip and spine | Internal structure and resilience |
| Bone quality (REMS Fragility Score) | Structural integrity of bone tissue | Not available through a standard scan |
| Combined (REMS) | Both density and quality in one session | Nothing left unexamined |
A 2021 European multicenter study across five clinical centers, with 4,307 participants, found that REMS had a sensitivity of 90.4% and a specificity of 95.5% at the femoral neck, with a sensitivity of 90.9% and specificity of 95.1% at the lumbar spine.
The study confirmed strong diagnostic agreement with DXA while adding structural bone data a standard scan does not provide.
REMS is radiation-free, FDA-registered, and not affected by arthritis, scoliosis, or metal implants. It produces both density and quality data in a single session, with results available the same day.
When You Should Reassess or Track Your Bone Health
A single set of bone density scan results gives you one data point. Real clarity about your bone health comes from tracking how that data changes over time — and with REMS, that tracking can happen on a timeline that actually reflects what is happening inside your bones.
Because REMS has a Least Significant Change of just 1%, compared to 4–6% for DXA, it can detect real, meaningful shifts in bone density and quality at the 6-month mark. That precision is what makes more frequent monitoring not just safe, but scientifically worthwhile.
| T-Score Range | Suggested Rescan Interval | Key Reason |
| -1.0 or above (Normal) | Every 6–12 months | Confirm stability; catch early shifts before they progress |
| -1.0 to -1.49 (Mild osteopenia) | Every 6–12 months | Track whether lifestyle efforts are producing results |
| -1.5 to -2.49 (Moderate to advanced osteopenia) | Every 6–12 months | Monitor progress closely during the most actionable window |
| -2.5 or lower (Osteoporosis range) | Every 6–12 months | Measure whether your bone health plan is working |
With radiation-free REMS, a 6 to 12-month rescan interval carries zero cumulative radiation concern. You get meaningful data, on a timeline that keeps your bone health moving in the right direction.
For a full breakdown of rescan timelines by T-score range and personal risk level, our guide on how often you should get a bone density scan provides clear, step-by-step guidance built around specific findings.
Frequently Asked Questions
What do my bone density scan results actually mean?
Bone density scan results show how your bone mineral density compares to a reference group. The T-score tells you where you stand relative to a healthy young adult.
A score of -1.0 or above is normal. Between -1.0 and -2.49 is osteopenia. At -2.5 or below, results fall in the osteoporosis range.
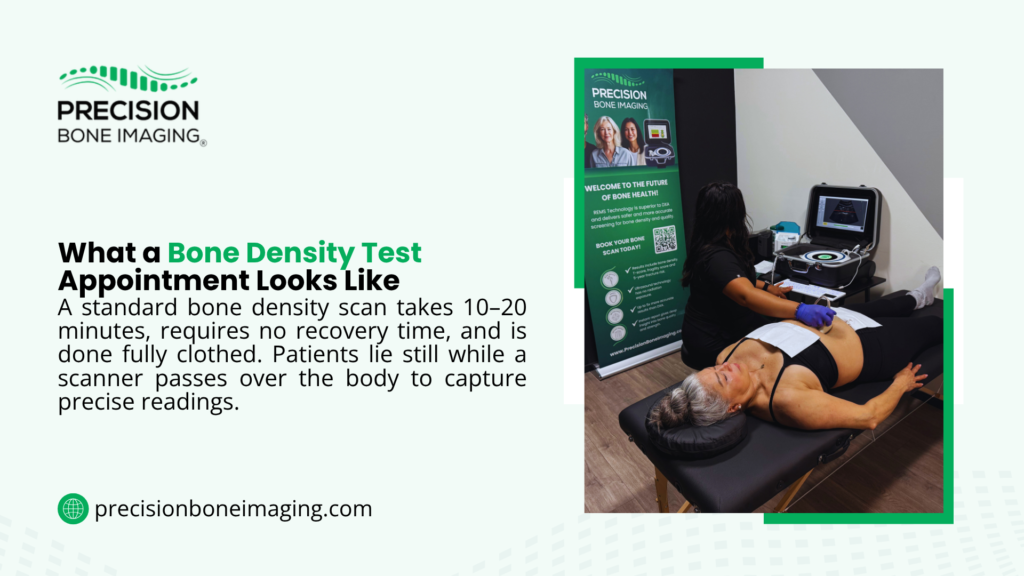
How do I read my bone density test results?
- Find your T-score on the report
- Compare it to the three standard ranges: normal (-1.0 or above), osteopenia (-1.0 to -2.49), osteoporosis range (-2.5 or lower)
- Check your Z-score, especially if you are under 50
- Note which body site the score covers: spine, hip, or both
- Look for any additional quality or fragility data if a REMS assessment was done
- Review the full report with your healthcare provider for proper context
What is a normal T-score for bone density?
A T-score of -1.0 or above is in the normal range per World Health Organization classification. It means your bone density is at or above the average for a healthy young adult.
What does osteopenia mean compared to osteoporosis?
- Osteopenia means lower than average bone density, with a T-score between -1.0 and -2.49.
- Osteoporosis means significantly reduced bone density, with a T-score of -2.5 or below.
- Osteopenia does not automatically progress to osteoporosis, especially with early lifestyle action.
What is the average T-score for a 60-year-old woman?
T-scores vary by individual based on genetics, lifestyle, and health history. Most women in their 60s fall between -1.0 and -2.5, placing them in a range where consistent exercise, proper nutrition, and regular assessment deliver the most practical benefit.
How accurate are bone density scan results?
A 2021 European multicenter study with 4,307 participants found REMS had a sensitivity above 90% and specificity above 95%, showing strong diagnostic agreement with DXA while also capturing bone quality data.
A Final Note
Bone density scan results are not a final answer on your health. They are a starting point for clarity. T-scores and Z-scores provide reference points, not verdicts. Bone quality, your lifestyle habits, and consistent follow-up complete the picture that numbers alone cannot show.
The most direct step available right now is to know your full bone health status, both density and quality, so you have a real foundation to act from.
Take the Next Step With Precision Bone Imaging
Your bone density scan results show where things stand. Precision Bone Imaging helps you understand what to do next.
With more than 4,275 completed assessments across 49+ locations, Precision Bone Imaging provides radiation-free REMS bone health assessments in Los Angeles and Phoenix with nationwide locations coming in 2026.
Every session delivers instant findings on both bone density and bone quality, with clear guidance on what your results mean and where to go from here.
REMS technology at Precision Bone Imaging is FDA-registered, CE-marked, and validated to offer:
- Zero radiation exposure, safe for frequent and repeat assessments
- Instant results available the same day
- Complete bone density and quality data in a single session
- No impact from arthritis, scoliosis, or metal implants
- Up to 30% more accurate fracture risk assessment than traditional DXA
- 40% greater sensitivity to changes in bone quality
Book your radiation-free bone health assessment today. Know your strength. Protect your future.
This assessment is for informational purposes only and does not replace medical care.